The 2022 Redistricting Cycle in 10 Graphics
August 4, 2022 · 2:29 PM EDT
With the 2022 redistricting cycle coming to a close over the summer, we now know what all 435 congressional districts will look like this November.
As each state drew its new congressional map, Inside Elections profiled and rated every new district. In the process, 127 original maps, gifs, charts, and tables were created to illustrate the changes and highlight the takeaways. The finalization of the nationwide map provides a good opportunity to look back at the major storylines and themes of the redistricting process, using a handful of those graphics as a guide.
1. Some states gained districts
Five states — Colorado, Florida, Montana, North Carolina, and Oregon — gained one seat as a result of Census reapportionment, while Texas picked up two. This continues a trend seen across recent decades, wherein states in the West and the South have generally added members to their congressional delegations.
In Montana, the addition of another district created a path back to Congress for former Interior Secretary Ryan Zinke, who represented the state’s at-large seat from 2015 to 2017. With current at-large Rep. Matt Rosendale staying in the new 2nd District, Zinke is running in the new 1st, located in the western part of the state. After narrowly winning the GOP primary in June, Zinke will face Democratic attorney/2020 Public Service Commission nominee Monica Tranel this November. Inside Elections currently rates the race as Likely Republican.
2. Some states lost districts
Seven states — California, Illinois, Michigan, New York, Ohio, Pennsylvania, and West Virginia — all lost a congressional representative this cycle. While states in the Midwest and Northeast have typically shed seats in recent redistricting years, this was only the second time since gaining statehood in 1850 that California did not add a district from decennial reapportionment (the other came after the 1920 census, when its delegation remained at 11 members).
West Virginia saw the largest percentage decrease of any state over the last decade, with its population dropping by nearly 60,000, or 3.2 percent, between 2010 and 2020. This ultimately led to the dissolution of the 3rd District, setting up a member-vs.-member GOP primary in the redrawn 2nd District between Reps. David McKinley and Alex Mooney. Mooney, who had the endorsement of former President Donald Trump, defeated McKinley by 18 points, 54–36 percent, in May, and is all but guaranteed a fifth term in this Solid Republican seat.
3. Some states still only have one congressional district
With Montana gaining a second district, only six states will retain an at-large seat for the next decade: Alaska, Delaware, North Dakota, South Dakota, Vermont, and Wyoming.
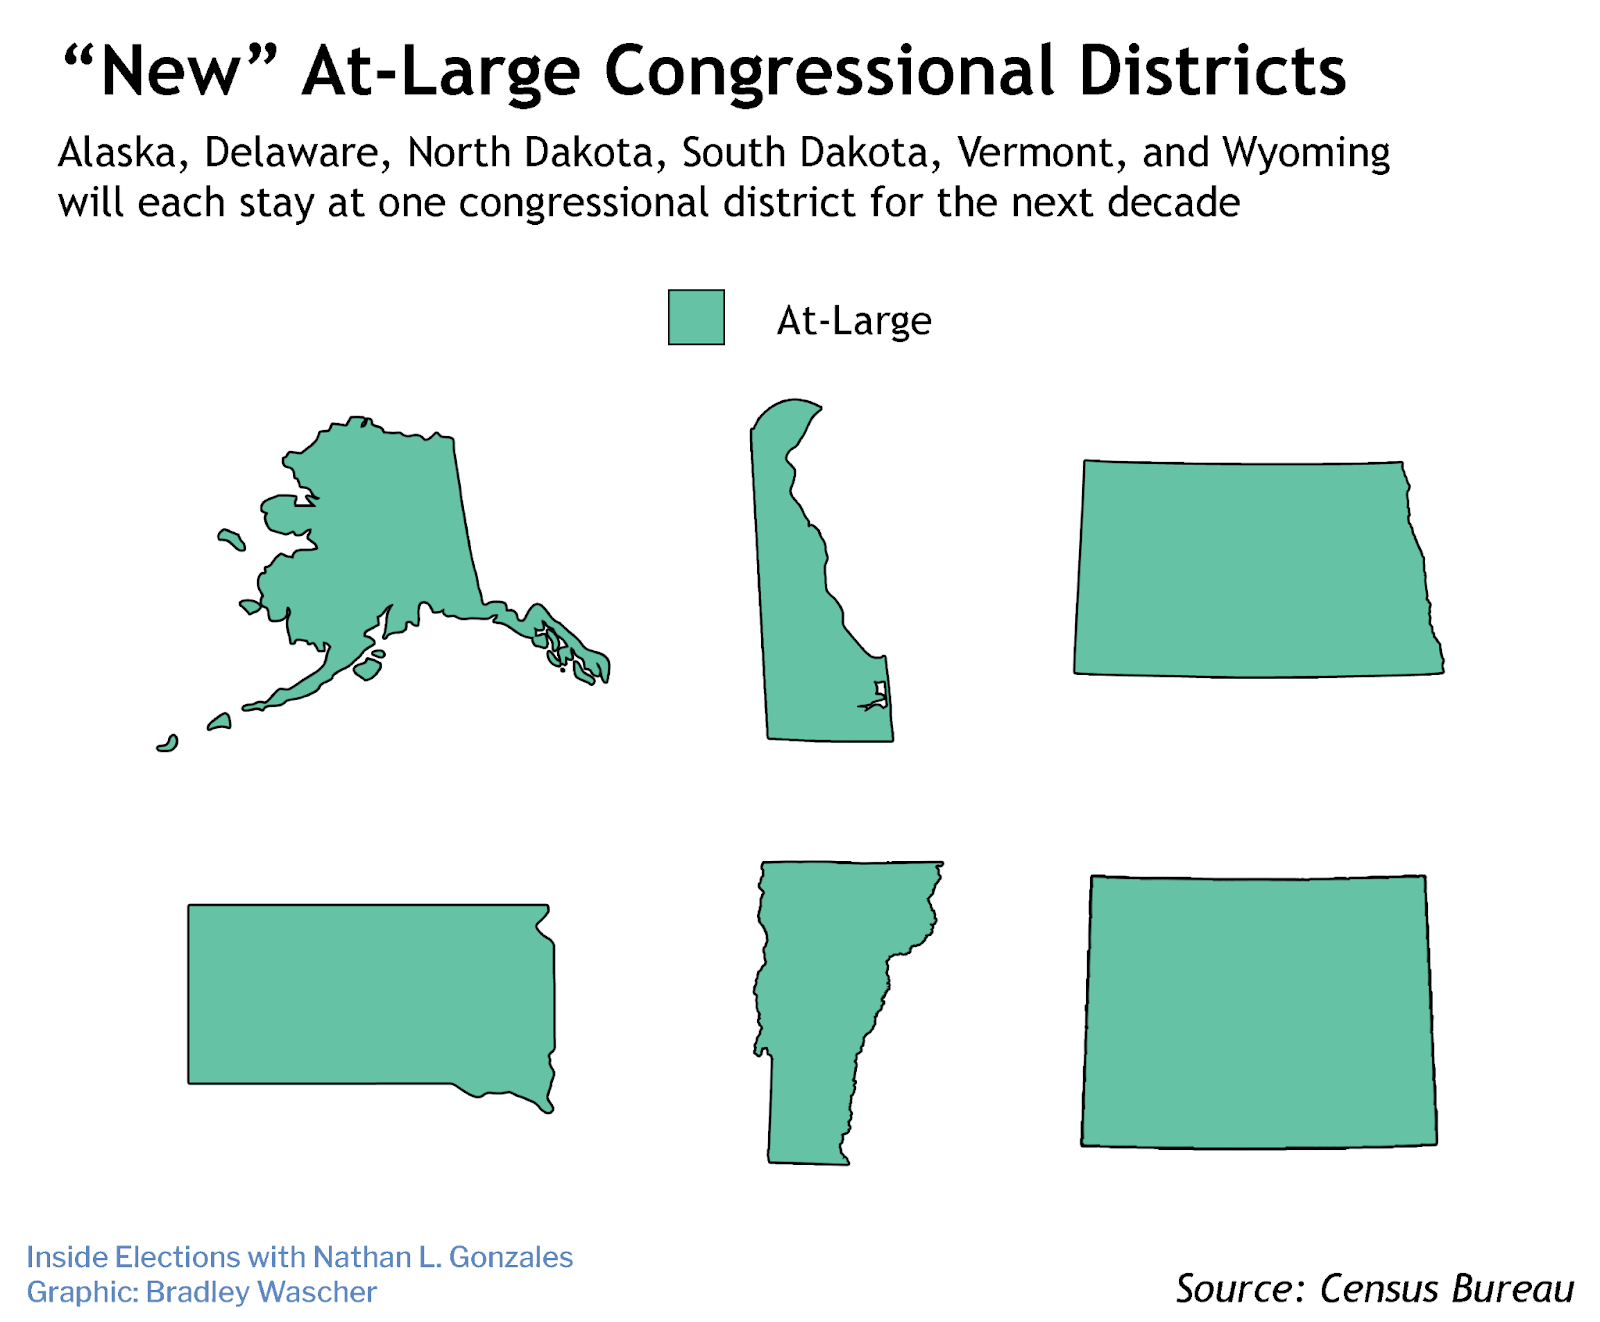
Of those, Delaware had the largest population (approximately 990,000), also making it the state with the highest average population per district, according to the Congressional Research Service. While North Dakota’s population increased by nearly 16 percent between 2010 and 2020, the fastest growth of the six states with an at-large district, the Peace Garden State still fell at least 200,000 heads short of a second district.
All six at-large districts are uncompetitive in November. Alaska, North Dakota, South Dakota, and Wyoming are all rated as Solid Republican (although there are noteworthy GOP primaries in Alaska and Wyoming). Delaware and Vermont are Solid Democratic.
4. Not all states saw major changes
Although redistricting can, in theory, offer opportunities to redesign districts or undo instances of malapportionment, congressional lines in many states don’t change all too much between cycles. In Wisconsin, for example, the reason was a mix of partisan disagreement and judicial discretion. After Democratic Gov. Tony Evers found himself at odds with the Republican-controlled state legislature, the state Supreme Court adopted a least-change map, or one that closest resembles the current arrangement.
Rhode Island is another state where the old and new congressional maps ended up being very similar, albeit under different circumstances.
There was speculation prior to the census that Rhode Island would lose a seat during reapportionment, but that did not happen. Instead, its two districts saw only minor changes — reviving a streak from decades prior — with just a few precincts moved around Providence in the final plan. For one way of looking at it, Rhode Island’s new districts are, on average, approximately 99.1 percent similar to their current iterations, based on calculations from Daily Kos Elections.
But the new map could still lead to at least some electoral excitement, with Democratic Rep. Jim Langevin deciding to not seek re-election in the 2nd District. Between the crowded Democratic primary, the strength of likely Republican nominee Allan Fung, and the national environment favoring the GOP, the race is currently rated as Lean Democratic.
5. Some districts were renumbered
One of the more overlooked parts of congressional redistricting is the district numbers themselves: for any given state, why is the 1st District actually labeled as the 1st District? Typically there’s a bit of a pattern. Michigan, for one, requires such uniformity, with its Congressional Redistricting Act of 1999 stipulating, “each congressional district shall be numbered in a regular series, beginning with congressional district 1 in the northwest corner of the state and ending with the highest numbered district in the southeast corner.”
But every redistricting cycle, some states’ district numbers get shuffled around. This makes the most sense when seats are gained or lost, and even then, it’s often possible to identify new successors to outgoing predecessors. However, a few states shifted district labels despite keeping the same number of seats.
Iowa’s four districts, which divide the state into distinct quadrants, illustrate this well. Although the 3rd District remains in the southwest and the 4th in the northwest, the 1st and 2nd districts have “swapped” locations, with the 1st now in the southeast and the 2nd now in the northeast. Arizona also saw seven of its nine districts renumbered.
There is a method to the madness, though (at least in Iowa). Ed Cook, senior legal counsel for the nonpartisan Legislative Services Agency, told the Des Moines Register that Iowa’s numbering scheme has historically flowed from east to west, meaning the district that stretches the farthest east is assigned as the 1st.
In most cases, a district’s label has little legal or electoral bearing. But still, it can certainly be a point of brief confusion for voters — and lasting frustration for political analysts.
6. Democrats gerrymandered
In the lead-up to redistricting, narratives swirled that Republicans would be in the driver’s seat of the process. And it made sense: early calculations showed the GOP in control of drawing approximately 187 districts nationwide (43 percent), compared to around 75 for Democrats (17 percent). But in many of the states where they did have power, Democratic mapmakers pushed for plans that sought to entrench their party’s congressional advantage.
In certain states, such as Massachusetts, that simply meant solidifying existing lines. In others, including New Mexico and particularly Nevada, Democrat-passed maps could be viewed as high-risk, high-reward: some of their own incumbents are now more vulnerable, in exchange for Republicans being in even more precarious positions.
One state, Illinois, saw especially elaborate finessing. Between designing a new seat for Chicago’s Hispanic population, shoring up vulnerable members in suburban outskirts, and dissolving two Republican-held districts, Democrats could potentially extend their current eight-seat advantage in Illinois to ten or even eleven.
But the outcome in Illinois wasn’t completely seamless for Democrats. The redrawn map pitted two of the party’s own members, Reps. Sean Casten and Marie Newman, against each other in the June primary for the new, Likely Democratic 6th District; Casten won by a comfortable 68–29 percent. Republicans also grappled with a member-vs.-member matchup that night in the Solid Republican 15th District, where Trump-endorsed Rep. Mary Miller defeated Rep. Rodney Davis, 58–42 percent.
7. Republicans gerrymandered
As mentioned above, the GOP entered the congressional redistricting process with mapmaking control over two-in-five districts nationwide. Like Democrats, they used this to their benefit. The maps in Texas and Florida were among the most aggressive gerrymanders in the country, with those two states alone potentially netting Republicans up to six additional seats in November.
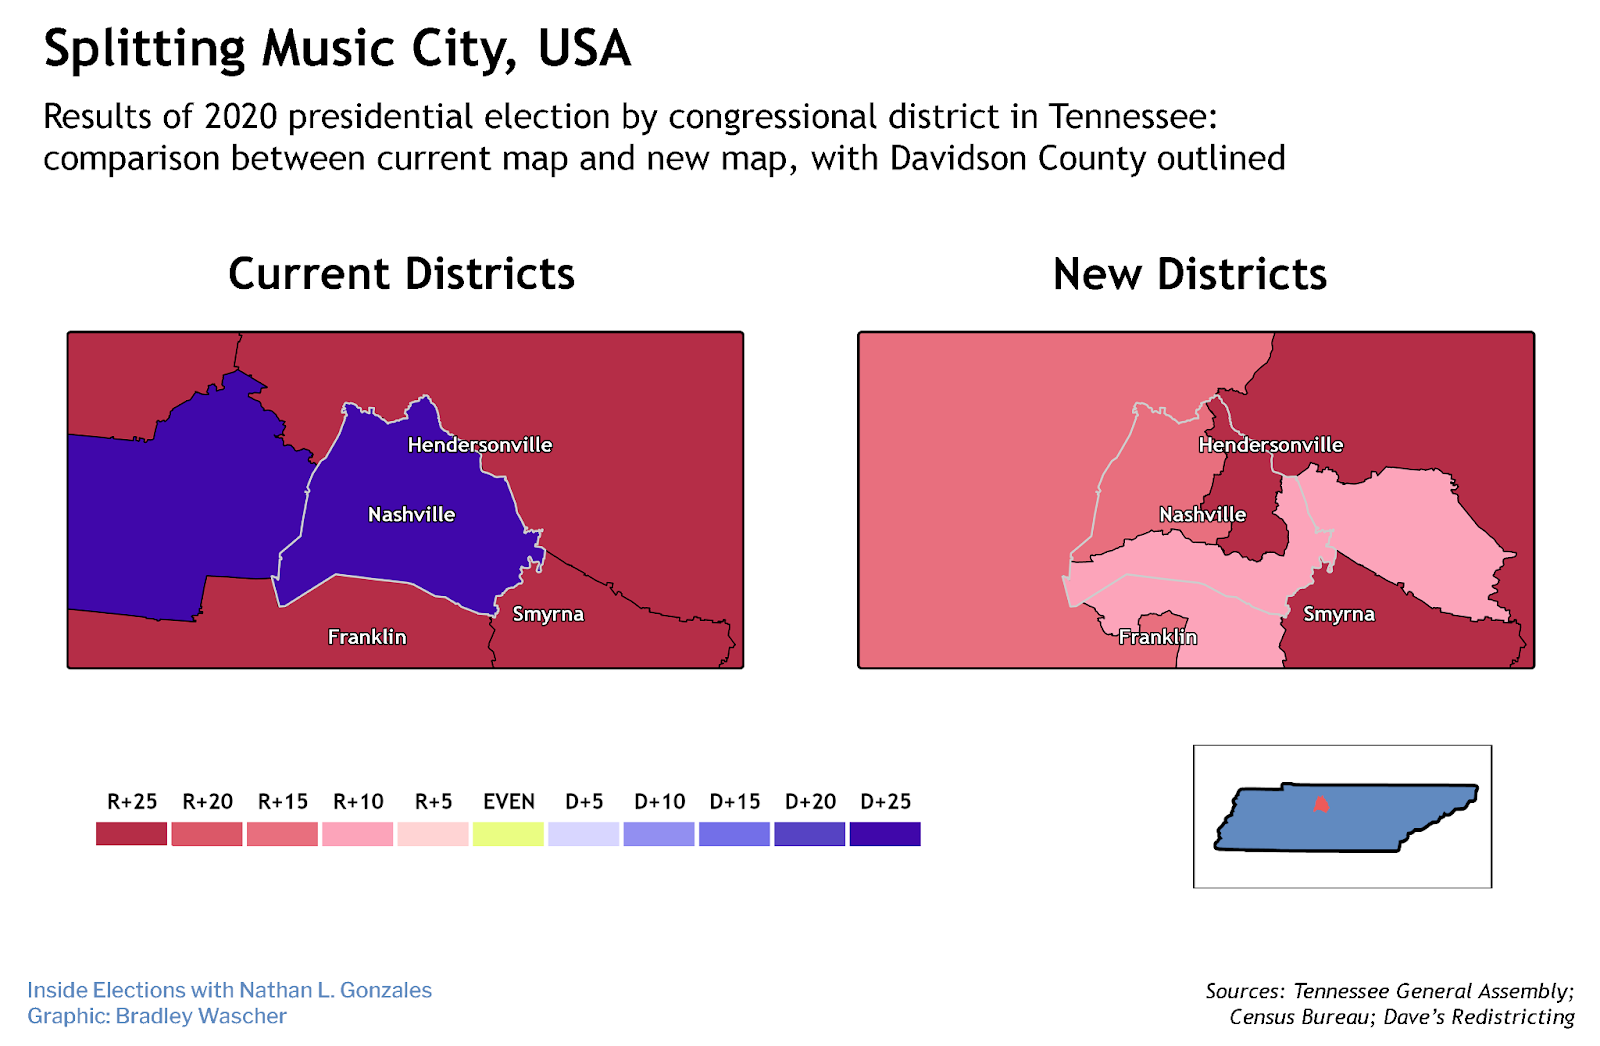
One gerrymandering tactic deployed by both Democrats and Republicans is “cracking” the other party’s voters across multiple districts. This cycle, Republicans split metropolitan areas in states including Arkansas (Little Rock), Kansas (Kansas City), Oklahoma (Oklahoma City), and Utah (Salt Lake City), diffusing Democratic votes — and sometimes outright eliminating entire Democrat-held districts.
The same happened in Tennessee. Davidson County, which contains Nashville, was previously entirely confined to the deeply Democratic 5th District. The new map divides Davidson across three Republican-favored districts, pushing longtime Democratic Rep. Jim Cooper to retire, and setting the stage for a crowded GOP primary.
But redistricting wasn’t always smooth in states where Republicans had control. In Missouri and New Hampshire, the final two states to enact new lines this cycle, the process was drawn out by GOP infighting over how hard to push, eventually producing maps that were largely status-quo in both cases.
8. Maps were thrown out
While it may seem like most of the high-profile gerrymanders this cycle came from Republicans, there’s an important caveat: many of the prominent Democratic gerrymanders were struck down.
Legal challenges during the redistricting process are nothing new, and this cycle proved no different. Judges played a role in deciding the fate of maps in Ohio, Pennsylvania, and Virginia, three familiar faces in recent redistricting cases. Overall, according to the Brennan Center for Justice, 72 cases in 26 states have been filed against congressional and state legislative maps on the basis of being racially discriminatory and/or partisan gerrymanders, as of July 25.
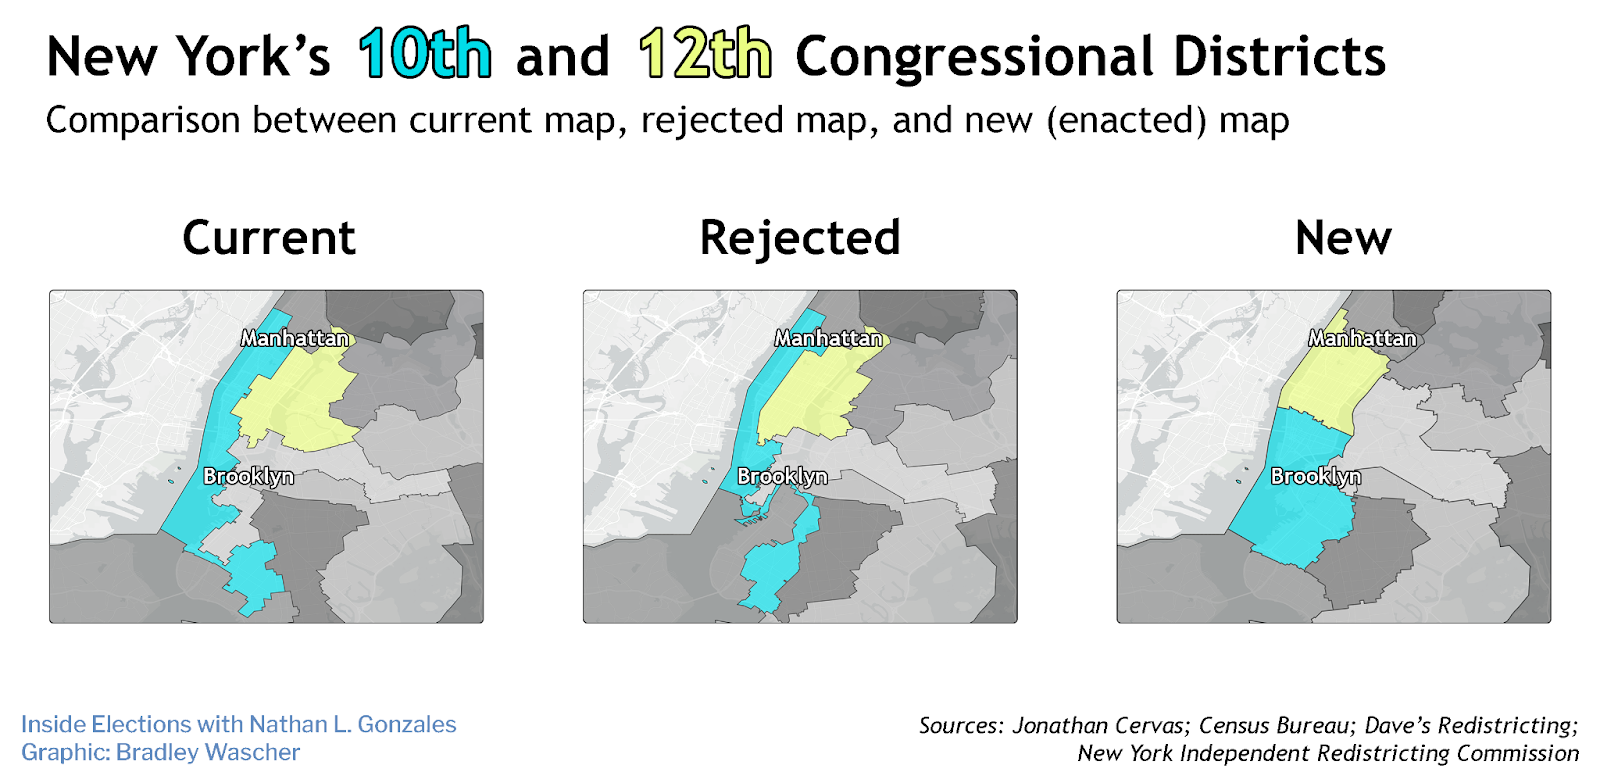
Had it not been rejected, the initial map in New York would have given Democrats the potential to flip three seats without sacrificing any of their own, partially balancing out GOP gains in other large states. But a Republican lower court judge ruled against the plan, the state’s Court of Appeals upheld the decision, and a special master was tapped to draw a remedial map.
The final approved map in New York contains up to eight competitive districts — along with major changes in Manhattan and Brooklyn. The new 12th District combines the Upper East Side and Upper West Side, meaning big-league Reps. Jerry Nadler and Carolyn Maloney will be on the same ballot in the August 23 Democratic primary. That leaves Nadler’s former 10th District, also heavily reconfigured, as an open seat, with a deep Democratic field that includes freshman Rep. Mondaire Jones and a slew of other progressives.
But New York's plan wasn’t the only to pass and then fail. The initial lines in Maryland were also thrown out, unraveling a map that would have put the state’s sole GOP-held seat in play, and replacing it with a map that makes Democratic Rep. David Trone's 6th District more competitive. The initial GOP-drawn plan in North Carolina was also struck down in the courts and replaced with a more competitive map (which will only be in effect for 2022).
9. Minority representation improved in some states, but not in others
One legal concern raised against some of the new maps is that they are unfairly drawn on the basis of race. At the heart of the discussion is the Voting Rights Act, which seeks to give racial groups equal opportunity in electing their preferred candidates. Although Black and Hispanic representation improved in a few states, both communities remain underrepresented elsewhere.
To be sure, Hispanic-favored districts were created in California and Colorado, two states whose lines were drawn by independent redistricting commissions, as well as Illinois . But not every state had such outcomes. For example, no new seats were designed to represent Hispanic, Black, and Asian communities in Texas, despite those groups contributing overwhelmingly to the state’s population growth since 2010. Nevada’s 1st District, which previously had a Hispanic plurality, is now predominantly white.
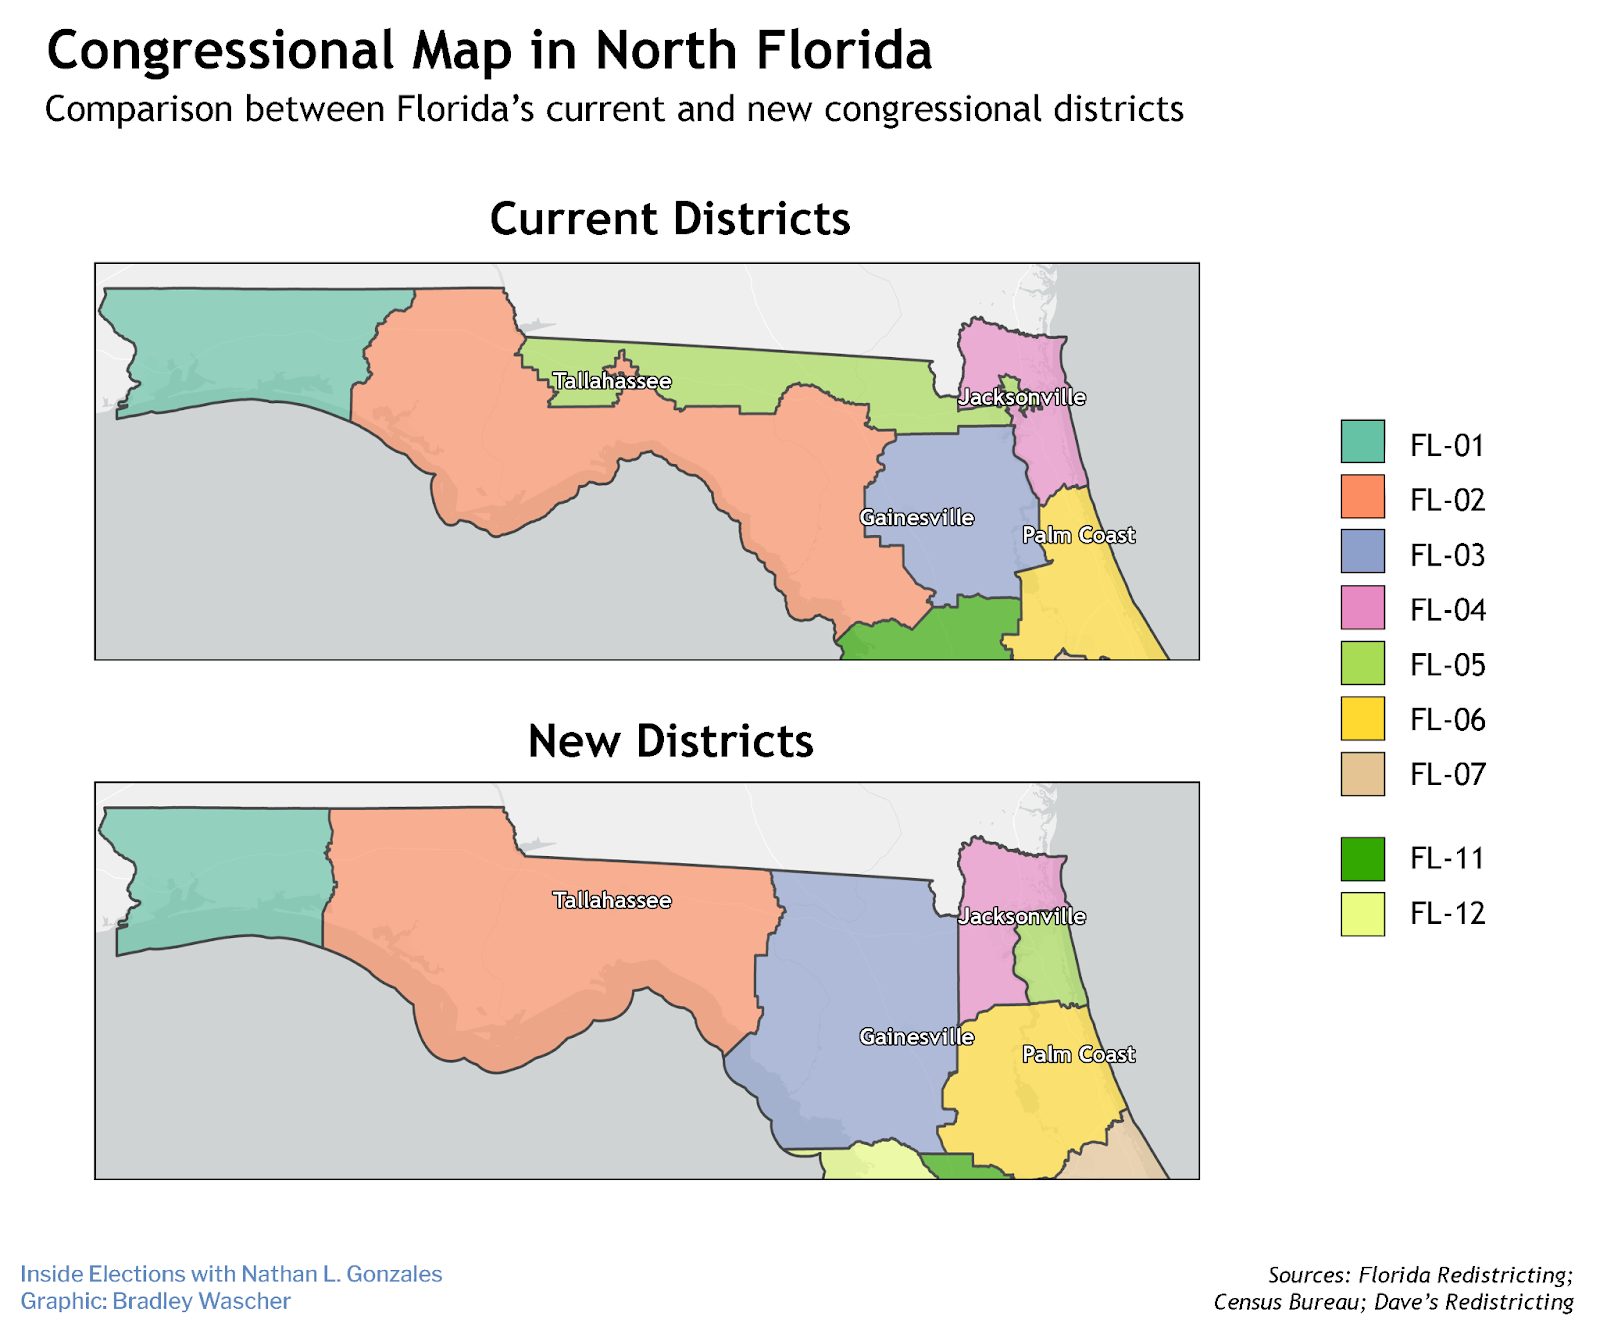
Black voters in the South also won’t receive as much representation as they could have. In Florida, Democratic Rep. Al Lawson’s heavily Black 5th District was effectively eliminated, while Black voters in the Orlando area are now divided between the 10th and 11th districts.
In Louisiana, many Democrats advocated for the creation of a second heavily Black seat: the state is 33 percent Black, but just one of its six seats (17 percent) is majority Black. Democratic Gov. John Bel Edwards even vetoed the plan passed by Republican mapmakers on these grounds. But following a veto override in late March, and a court decision later stayed by the Supreme Court, the 2nd District will remain the state’s only majority-Black seat.
There were also legal pushes to add a second heavily Black district in Alabama, a state where approximately one-quarter of the population is Black but only one of its seven districts elects a Black member. However, in February, the Supreme Court ruled there was not enough time before the midterms to enact a new map.
10. There are fewer competitive districts
One final theme throughout the 2022 redistricting cycle is the loss of competitive districts. There are many different ways to measure competitiveness, but most tell a similar story.
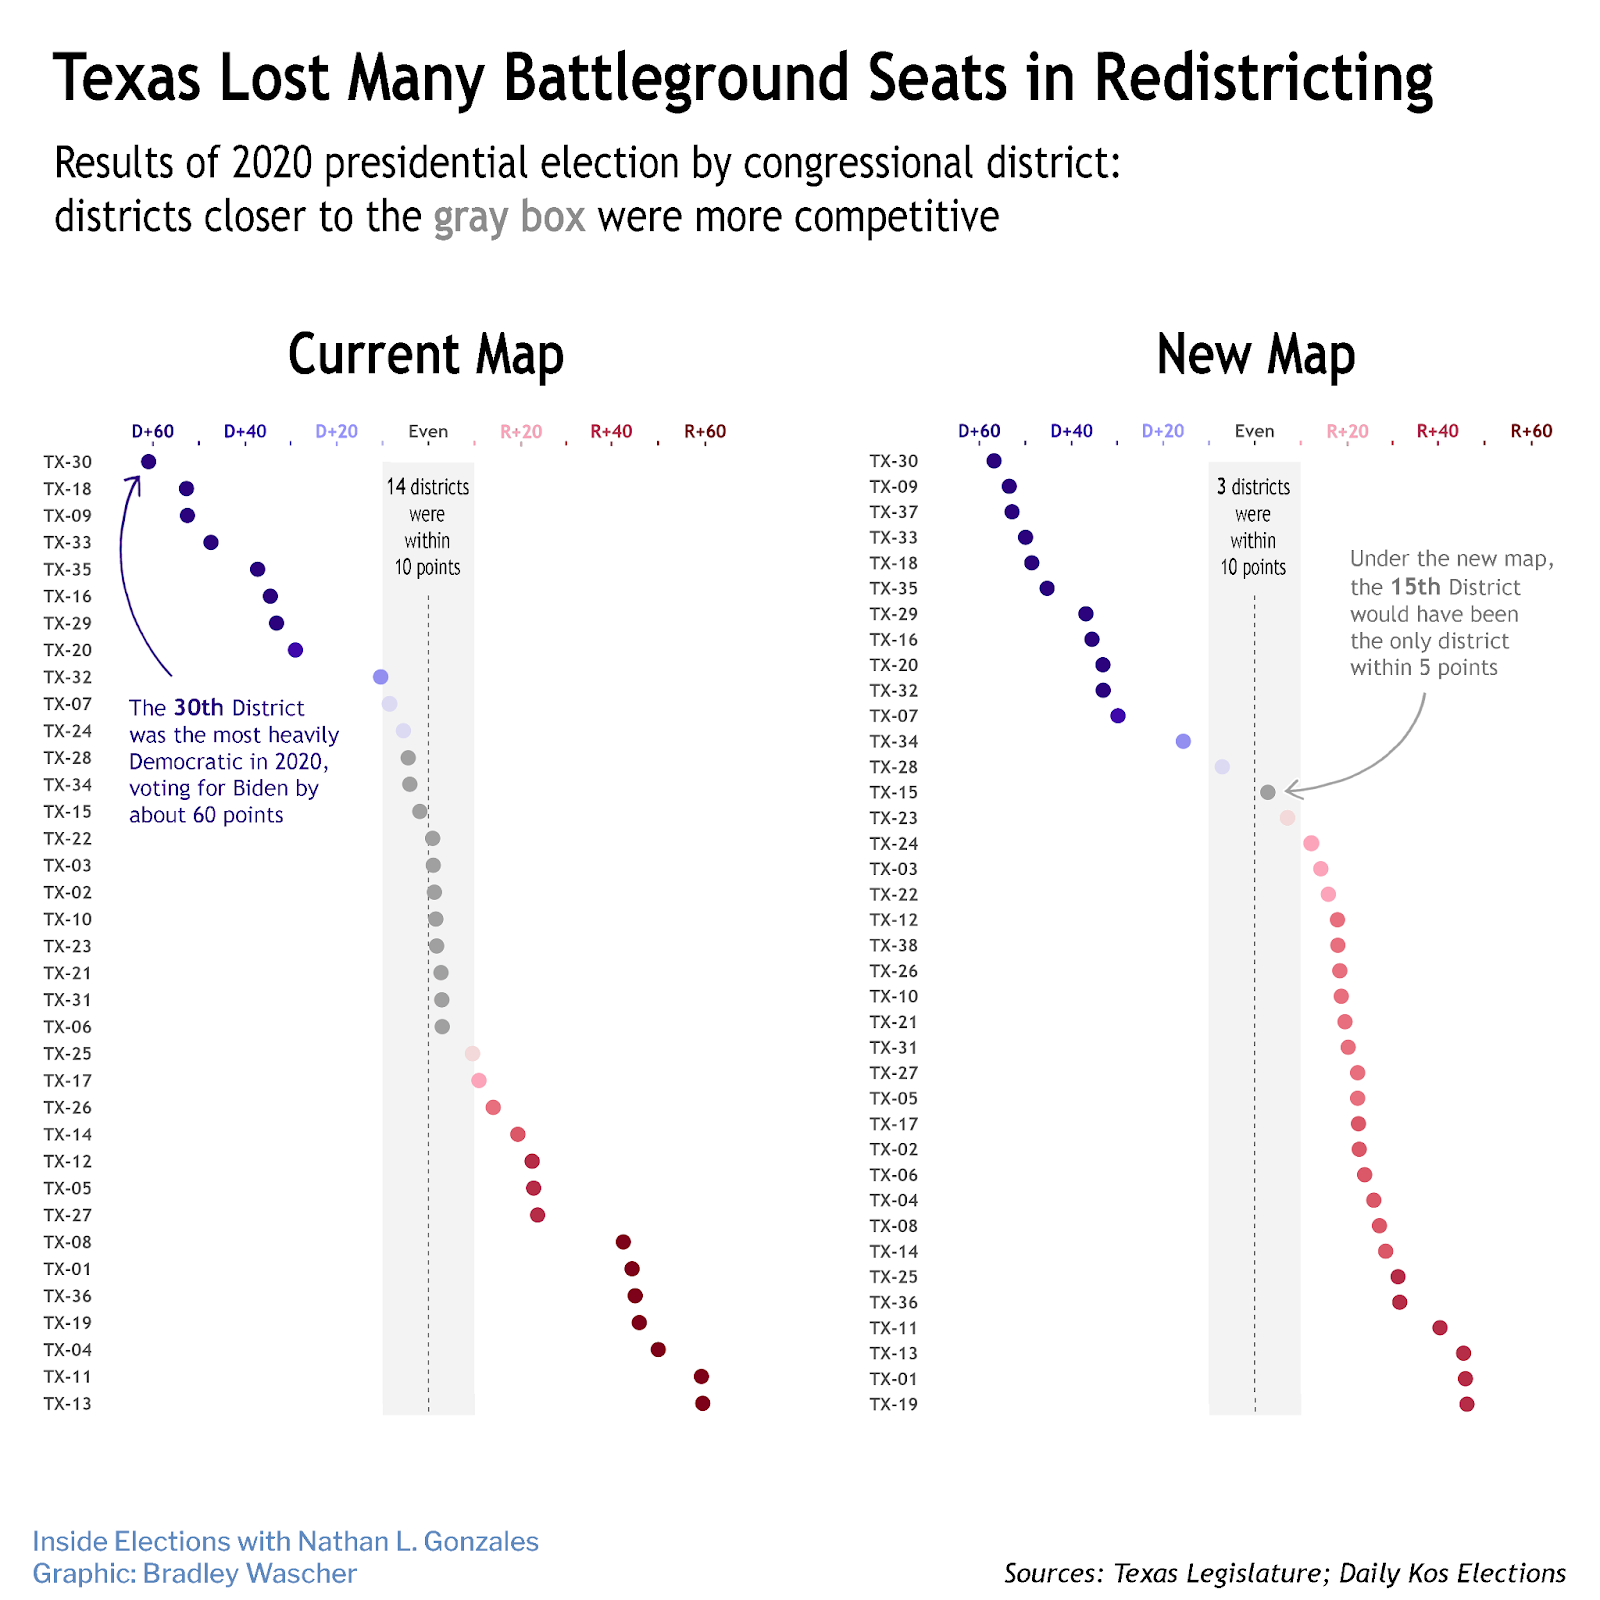
The prime example — we’ve been saving this one for last — is Texas. Under the outgoing map, 14 of the state’s 36 current congressional districts (39 percent) voted within 10 points for either President Donald Trump or Joe Biden in 2020. But under the new map, only three districts out of 38 (8 percent) would have voted within the same margin for either candidate. Similar patterns exist when tightening the band from 10 points to 5 points.
More broadly, there are also fewer competitive districts nationwide. Across all states’ new maps, only 34 districts would have voted for either Biden or Trump within 5 points, which is 17 fewer compared to the outgoing maps.
This trend is not new for 2022: the number of competitive districts has been dwindling for decades. And in many cases, the Toss-up and Tilt seats aren’t being replaced by Lean or Likely seats; they’re being replaced by safe seats.