Methodology: Inside Elections’ Baseline by Congressional District
December 8, 2023 · 11:29 AM EST
To calculate Inside Elections’ Baseline, we include all contested partisan elections for federal and statewide offices (executive or constitutional) in the four most recent cycles, as well as any special or off-year elections during that span. The only district-based elections we consider are U.S. House races.
These results are then combined in an index estimating the strength of a “typical” Democratic or Republican candidate in any particular congressional district.
This project requires a comprehensive collection of statewide election results by congressional district. But because most states don’t officially report down ballot races at this level, we calculated them manually.
Data
Our first step was to collect data for each election of interest. We gathered precinct-level results from four main sources: official returns were pulled directly from state or county elections websites whenever feasible, while gaps were filled with invaluable data from VEST, OpenElections, and the MIT Election Lab. In theory, full precinct-level results are only necessary in counties that are split between multiple districts. But we wanted to be as thorough as possible for a project of this scope and scale.
Because different sources format their results in different ways, we wrote code to systematically reshape a dataset from one source and fit it with data from another; a sample R script can be found on GitHub. Many races also required substantial — or in some cases total — manual input. This eventually produced a database of over 2.7 million precincts covering 753 unique elections in all 50 states between 2016 and 2022, with the full set of results by congressional district spanning approximately 7950 lines.
Assigning Precincts to Districts
A key part of this process is determining which precincts fit into each district. For elections conducted in 2022, this is fairly straightforward: simply check the 2022 House results to see where each precinct was assigned, then apply that to the statewide races.
But because precinct boundaries can change between cycles, it's tougher to retroactively fit old elections into new districts (for example, breaking down the 2020 presidential race by the 2022 congressional lines). This is especially true at the beginning of a new decade, as entire districts were created and eliminated following census reapportionment, and many seats were heavily redrawn in redistricting.
Our initial plan was to use GIS mapping software to overlay district maps onto precinct maps, then make a list of the crossovers. This worked well for compact districts and districts with large land areas. But it proved to be less dependable when districts were densely packed or oddly shaped: sometimes the lines in the provided shapefiles didn’t align perfectly when switching between a large electoral geography (congressional districts) and a small one (precincts).
Luckily, we could convert from small to smaller. Redistricting data plans are almost always accompanied by a block assignment file that sorts census blocks into districts. Because blocks are generally smaller than precincts, this is in many cases the closest thing to an official translation between large and small geographies — a redistricting Rosetta stone.
We first overlaid precinct maps onto block maps from the Census Bureau to see which blocks belonged in each precinct. Then, we consulted the block assignment file to see which blocks matched with each district. With help from this middleman, we could more reliably determine which precincts fit into each district. This process was then repeated for each precinct map in each state in each election year.
Splitting Precincts: It’s Easy
After compiling a list of precincts and their corresponding districts, there’s one final hurdle: split precincts. Although precincts are usually the smallest unit of election administration, they can still be divided between multiple districts. And when that happens, there’s almost no way to know exactly how its votes were allocated.
Thankfully, there’s a solution for elections that were run with a concurrent district map (e.g. 2022 Senate elections broken down by the congressional lines used in 2022; or — if we were analyzing last decade’s map — 2017 treasurer by the congressional districts used in 2016 or 2018).
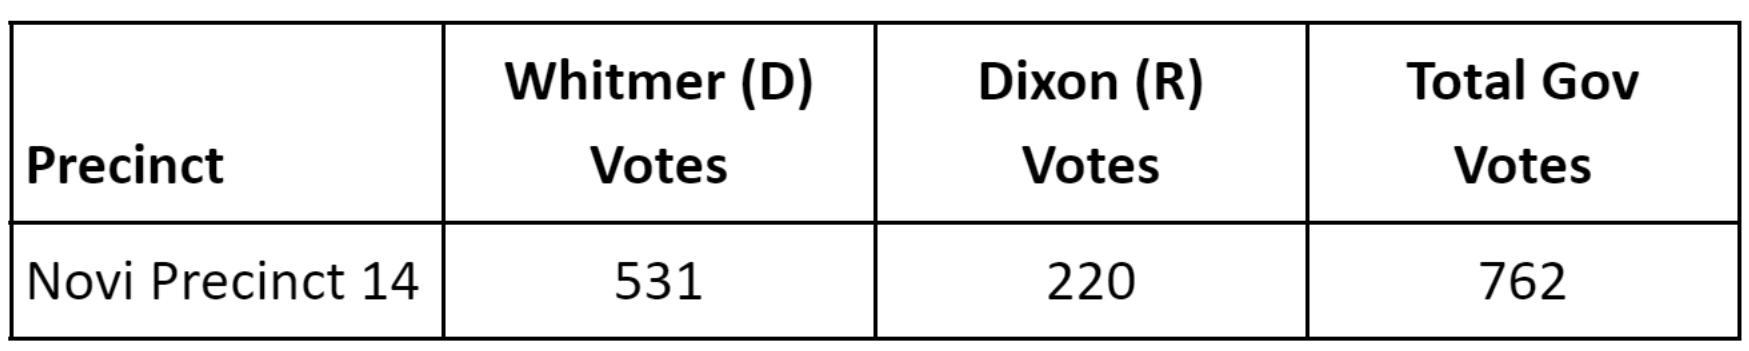
For example, take the results of Michigan’s 2022 governor race in Novi Precinct 14. Split between the 6th and 11th districts in Oakland County, this precinct awarded 531 votes to Democratic Gov. Gretchen Whitmer, 220 votes to Republican Tudor Dixon, and 762 votes in total.
Meanwhile in that year’s House elections, 40 percent of Democratic votes, 49 percent of Republican votes, and 43 percent of total votes were cast from the portion of this precinct located within the 6th District. All other ballots came from the section in the 11th.
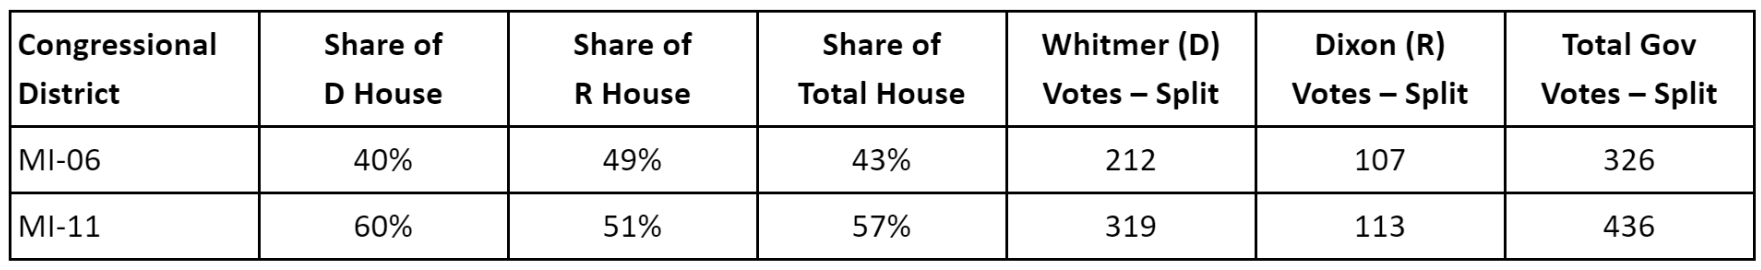
Therefore we would designate 212 of Whitmer’s votes — or 40 percent of her 531 total — to the 6th District, with the remaining 319 votes to the 11th. Republican votes and total votes are sorted the same way.
Similar workflows were used to allocate unassigned votes, although those were already reconciled in certain precinct-level datasets. (It is also worth noting that there are other ways to assign votes in unclear edge cases; Daily Kos Elections’ own methodology report covers them well.)
Splitting Precincts: It’s Hard
Although the preceding procedure can be used to split precincts in elections that were conducted alongside a concurrent congressional map, it isn’t a viable option when retroactively analyzing old races using brand-new districts.
Anyone who wants to split the electoral atom must first make a key assumption about assigning votes — and there’s no single right answer.
In cases where a precinct is divided between multiple districts without any suitable comparison to a congressional race (so in our analysis, any election before 2022 broken down by the 2022 lines), our policy is to allocate a split precinct’s votes across all districts evenly.
This methodological decision notably differs from other standard techniques, such as assuming votes are allocated proportionally (e.g. measuring how much of a precinct’s land area is located in each district) or even making educated guesses by eyeballing maps. This means our toplines might differ slightly from results produced using alternate methods.
But for Baseline in particular, we believe dividing votes evenly is the most defensible and repeatable solution given the project’s scale, scope, and goals. So we calculated our own district-level breakdowns for all elections of interest — including those already crunched by other sources — to build consistency in the Baseline database and potentially spotlight any systematic errors or biases in our approach.
Comparing both sets of numbers, the largest discrepancies were in districts with a large share of split precincts, as well as in competitive seats where differences in margin stick out due to rounding. But even in most worst-case scenarios, the various precinct-splitting methods landed within approximately 2 points of each other.
Fortunately, 2016, 2018, and 2020 will eventually be replaced by 2022, 2024, and 2026 in future Baseline calculations — meaning with each passing year, this methodological distinction matters less.
Putting It Together
Once all precincts have been properly split and allocated, the final step is to add everything up to the district level, then repeat this process for each election of interest in the district. Consider the full breakdown of results in Massachusetts’ 9th District:
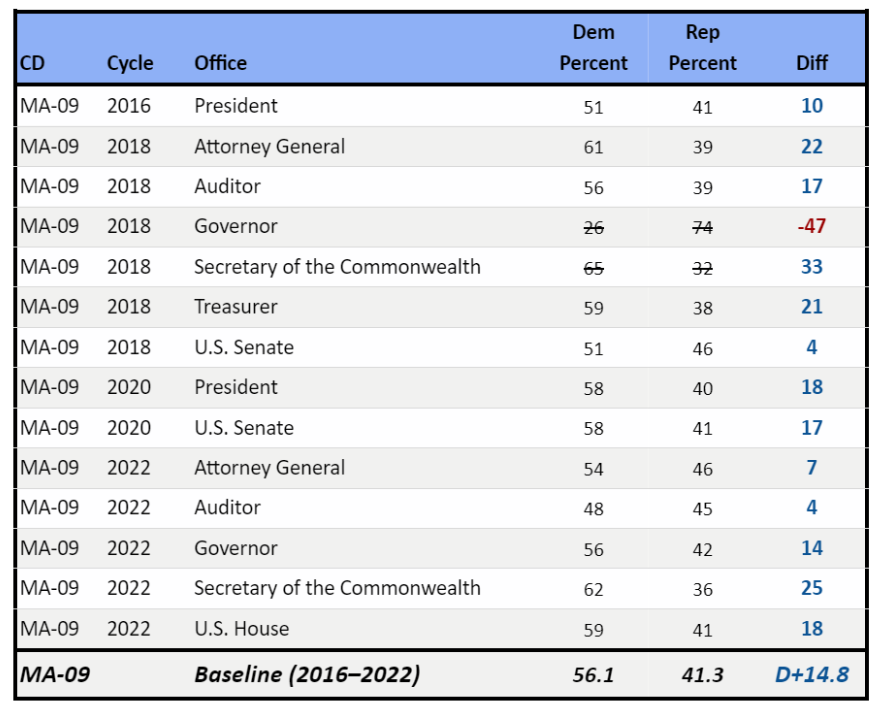
Baseline’s major advantage — its depth — is quickly clear. The two most commonly cited elections at the congressional district level are the most recent House and presidential races, both of which saw the Democrat win by around 18 points in this seat. But with the added context of a dozen down ballot races, we get a better sense of the 9th’s elasticity, and of each party’s “true” vote ceiling or floor.
We can also check to see how the district’s partisan preferences hold up in different national environments: compare the margins in the 2018 cohort of races (when Democrats carried the national House popular vote by 8.6 points) to those in 2022 (when Republicans won by 2.8 points).
To calculate each party’s Baseline, simply take the trimmed mean of all previous elections — in other words, an average omitting the highest and lowest values for each party.
In the 9th District, the formula drops Democrats’ strongest performance (65 percent in the 2018 secretary of the commonwealth race that saw William Galvin earn his seventh term), as well as Republicans’ strongest performance (74 percent in then-Gov. Charlie Baker’s re-election that same year). The average also ignores each party’s weakest showing, which in this case happened to be those same races (Democrats’ 26 percent against Baker, and Republicans’ 32 percent against Galvin).
Ultimately, the 9th’s Democratic Baseline is 56.1 percent, while its Republican Baseline is 41.3 percent. The district’s Baseline margin — D+14.8 — suggests this seat is a few points more Republican-leaning than the two D+18 federal races would indicate on their own.